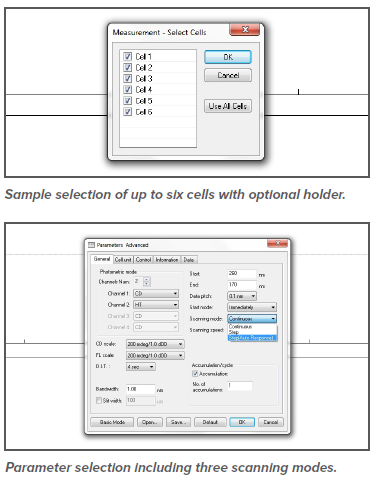
The only CD instrument designed to explore the structure and stability of biomolecules by providing the maximum signal-to-noise under highly absorbing, low light intensity conditions of the far-UV spectral region.
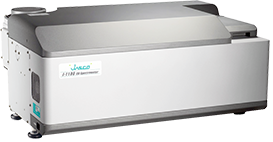
The J-1000 Series Circular Dichroism spectrophotometers are specifically designed for high sensitivity measurements in the near- and far-UV regions, for scientists that need confidence in the data from characterization studies of biomolecule structure, function and stability under a wide variety of experimental conditions.
Unlike some detectors which only provide good signal-to-noise for low absorbing materials, the J-1000 Series circular dichroism spectrophotometers uses high dynamic range detectors to obtain high quality spectra of samples with excellent signal-to-noise, especially for highly absorbing materials found in the far- UV.
The innovative optical system of the J-1500 permits the measurement of a CD spectrum in the vacuum-UV region down to 163 nm. The enhanced light throughput and new digital lock-in technology now allows for a small signal in a very noisy environment to be detected. Additionally, the optimization of the nitrogen purge efficiency helps to reduce the amount of oxygen in the optical bench so that it does not bury the sample signal.
These features ensure that CD spectra can be obtained from strongly absorbing and high signal-to-noise (S/N) samples across the spectrum and into the vacuum-UV region. The quality of spectral data obtained, including data obtained at shorter wavelengths, substantially improves the accuracy of protein secondary structure analysis.
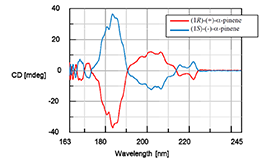
α-pinene enantiomers (gas phase) showing excellent performance in the Far-UV region.
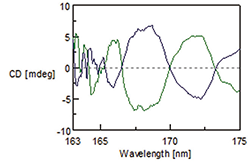
The same α-pinene sample showing similar superior performance in the vacuum-UV region down to 163 nm.
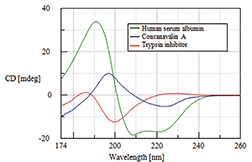
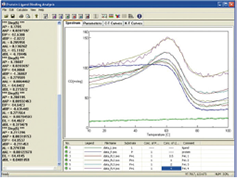
CD spectra of Human Serum Albumin (Helix rich), Concanavalin A (β-sheet rich) and Trypsin inhibitor (Random rich) in water with excellent signal to noise to 174 nm.
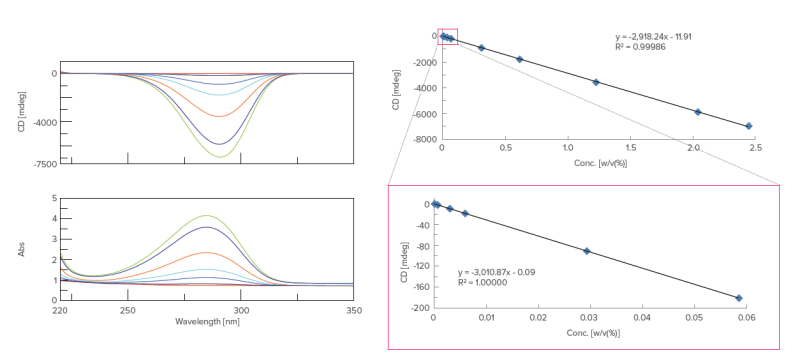
The PMT detectors used in the JASCO system are specially selected for the highest sensitivity and lowest birefringence. The wide dynamic range of the PMT detector ensures that large variations in signal intensity can still be detected, even for highly absorbing samples. The result is superior linearity between concentration and absorbance compared to other types of detectors including solid-state APD and CCD detectors.
The gain on a PMT detector is much larger (107) than most detectors, and therefore the signal amplification is larger. Under conditions with adequate light intensity, this typically leads to a larger amount of noise and therefore a lower S/N ratio. However, under conditions where there is a small amount of light hitting the detector (i.e. far-UV region), the gain of the PMT allows for good signal amplification at very low noise, increasing the S/N ratio.
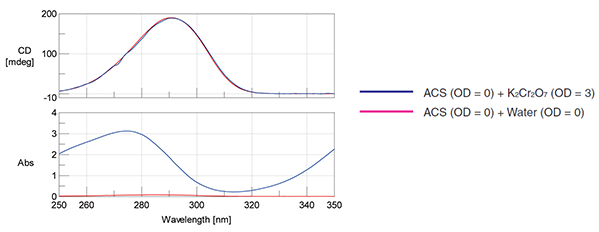
The double polarizing prism monochromators of the J-1000 series result in stray light lower than 0.0003%, enabling the instruments to obtain high-quality CD data even under conditions with high absorbances.
The latest quad-channel lock-in amplifier provides simultaneous acquisition of up to four data channels including CD, HT, DC, absorbance, linear dichroism (LD), fluorescence, fluorescence-detected CD (FDCD), fluorescence-detected LD (FDLD) and fluorescence anisotropy.
Additionally, the lock-in amplifier obtains a signal at a specific resonance frequency while filtering out noise signals at other frequencies, helping to provide spectra with excellent signal-to-noise ratios.
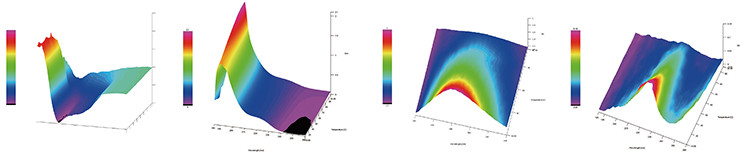
Multi-probe measurement of Lysozyme showing the simultaneous acquisition of CD, Absorbance, Ex Fluorescence and Em Fluorescence during a thermal-ramping experiment.
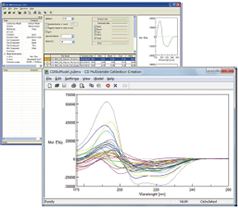
High sensitivity combined with a 10,000 nm-per-minute maximum scan speed allows the J-1500 to measure samples quickly, increasing productivity in your lab. An additional benefit is the minimal time exposure of biological samples to the high-energy UV light, minimizing the risk of sample degradation. A mechanical shutter can also be programmed to open and close only during actual measurement to further avoid UV exposure.
The high S/N (signal-to-noise) performance of the J-1000 series is achieved by a high throughput optical system and low-noise signal processing. RMS Noise < 0.004 mdeg (185 nm) for the J-1500 and J-1700, < 0.03 mdeg (200 nm) for J-1100.
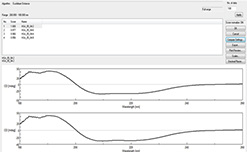
JASCO is the only manufacturer to develop a powerful, cross-platform 64-bit Windows software package for controlling a wide range of spectroscopic instrumentation.
Spectra Manager™ II is a comprehensive lab companion for capturing and processing data, eliminating the need to learn multiple software programs and allowing data from more than one instrument to be manipulated and displayed together on the same platform.
Quantitative multivariate analysis (PCR/PLS) program for the estimation of protein secondary structures from CD spectra. The reference data set supplied includes 26 proteins and is flexible to allow the user to add additional proteins as desired or even create an entirely new reference data set.
Allows users to quantitatively compare CD spectra. Researchers can now statistically determine the similarities in CD spectra and how they’re effected batch to batch, day to day, and more.
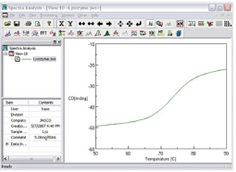
Enables calculation of the thermodynamic parameters (Tm, ΔH, ΔS) of protein from the data with variable temperatures.
Allows the dynamic analysis of proteins that are denatured in the presence of ligand, based on CD spectra with variable temperature of both the isolated ligand in solution and a set of spectra of protein and ligand mixtures.
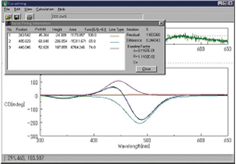
Curve fitting is a method used to resolve multiple components by finding the heights, widths and positions of overlapping bands contained in a spectrum and using a variety of regression algorithms including variable bandwidths.
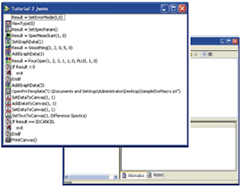
Allows full automation from data measurement to complete analysis and presentation using pre-set customizable templates in the JASCO Canvas program.
Click on the applications below for more information

Get more information by requesting our latest catalogue
Request
Check out JASCO's application notes for a wide range of industries
View All
First line maintenance service training
Learn More